Transform thousands of individual portfolios into a single strategic map. Instantly detect risk outliers, validate management consistency, and navigate your competitive position with objective precision.
The Weather Matrix: Complexity made simple
We process complex datasets to offer a clear strategic view. You no longer need to decipher hundreds of spreadsheets to understand your position. A single glance at the matrix positions every portfolio against market reality, saving you hours of manual analysis.

A “Sunny” status confirms you are outperforming the market average for your specific risk profile.
A “Cloudy” status alerts you that you are lagging behind your peers – high risk with low return, or insufficient risk-taking for the mandate.
Get performance insights that reflect your reality.
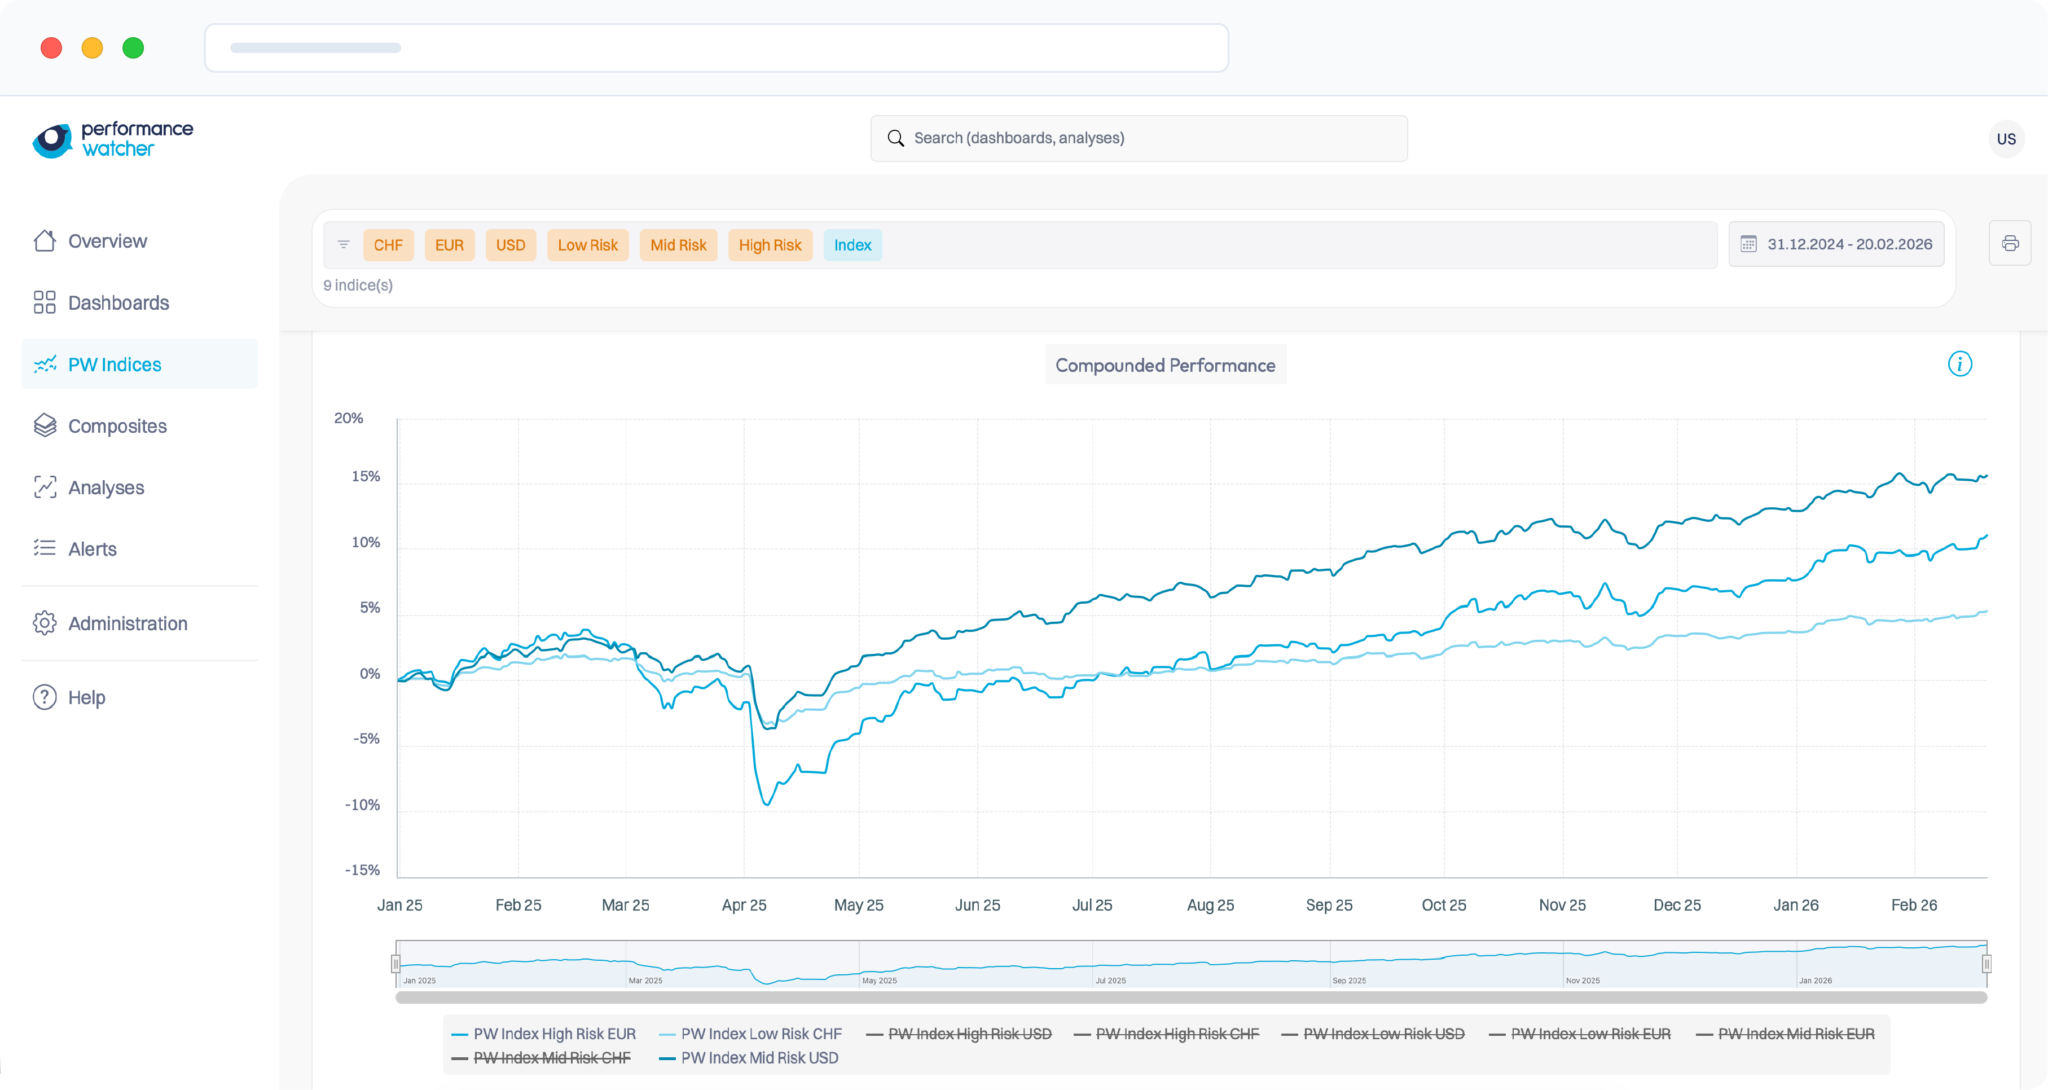
Comparing a risk-managed mandate to a sum of theoretical market indices like the S&P 500, SPI/ SMI, MSCI World creates noise and false expectations for your clients, investment committee, or any other stakeholder.
We benchmark your portfolios against the Performance Watcher Index (PWI). This live aggregation of thousands of portfolios represents the real-life performance of your direct competitors.
This independent reference acts as the neutral second opinion your clients, your board or leadership team need, allowing you to have a serene conversation about your investment beliefs.
”Performance Watcher allows us, independently of our own investment process, to obtain a simple and intuitive external view of the development of our portfolios. In addition, the extensive comparative data on other portfolios in the market provides valuable insights into relevant benchmarks.
Bilal JusufiPartner, Lakefield Partners AG
The unified solution to control, grow, and align.

Control your operations
Create Composites to aggregate your portfolios and analyze your firm’s true management style. Instantly detect if you are structurally aggressive, conservative, or drifting from your risk profiles.

Grow acquisition
Turn your verified track record into a marketing asset. Use third-party data to prove your value to prospects and build trust from the very first meeting.
Align your organization
Establish a single source of truth for your Board and team meetings. Objectively compare performance across multiple portfolios to unify your investment and relationship teams around shared facts.
Bring a new level of clarity to every stakeholder.
You no longer need to bury your Board, Investment Committee, or clients under hundreds of spreadsheets. They can now understand and interpret results immediately.


The Perfometer transforms sophisticated analysis into an intuitive visual standard. It provides an immediate outlook on your risk/return balance to answer the essential question: “Is our performance competitive?”.
Shift the conversation from defending technical metrics to discussing future strategy. Make your results accessible to everyone, from the financial expert to the end client.
Intuitive Visualization
A “sunny” or “cloudy” status makes complex risk/return metrics instantly understandable for non-experts.
Real-Time Data
Analysis powered by daily updates, ensuring your strategic decisions are based on the current reality, not last month’s report.
Objective Context
Positioning based on actual peer comparison rather than theoretical market indices.
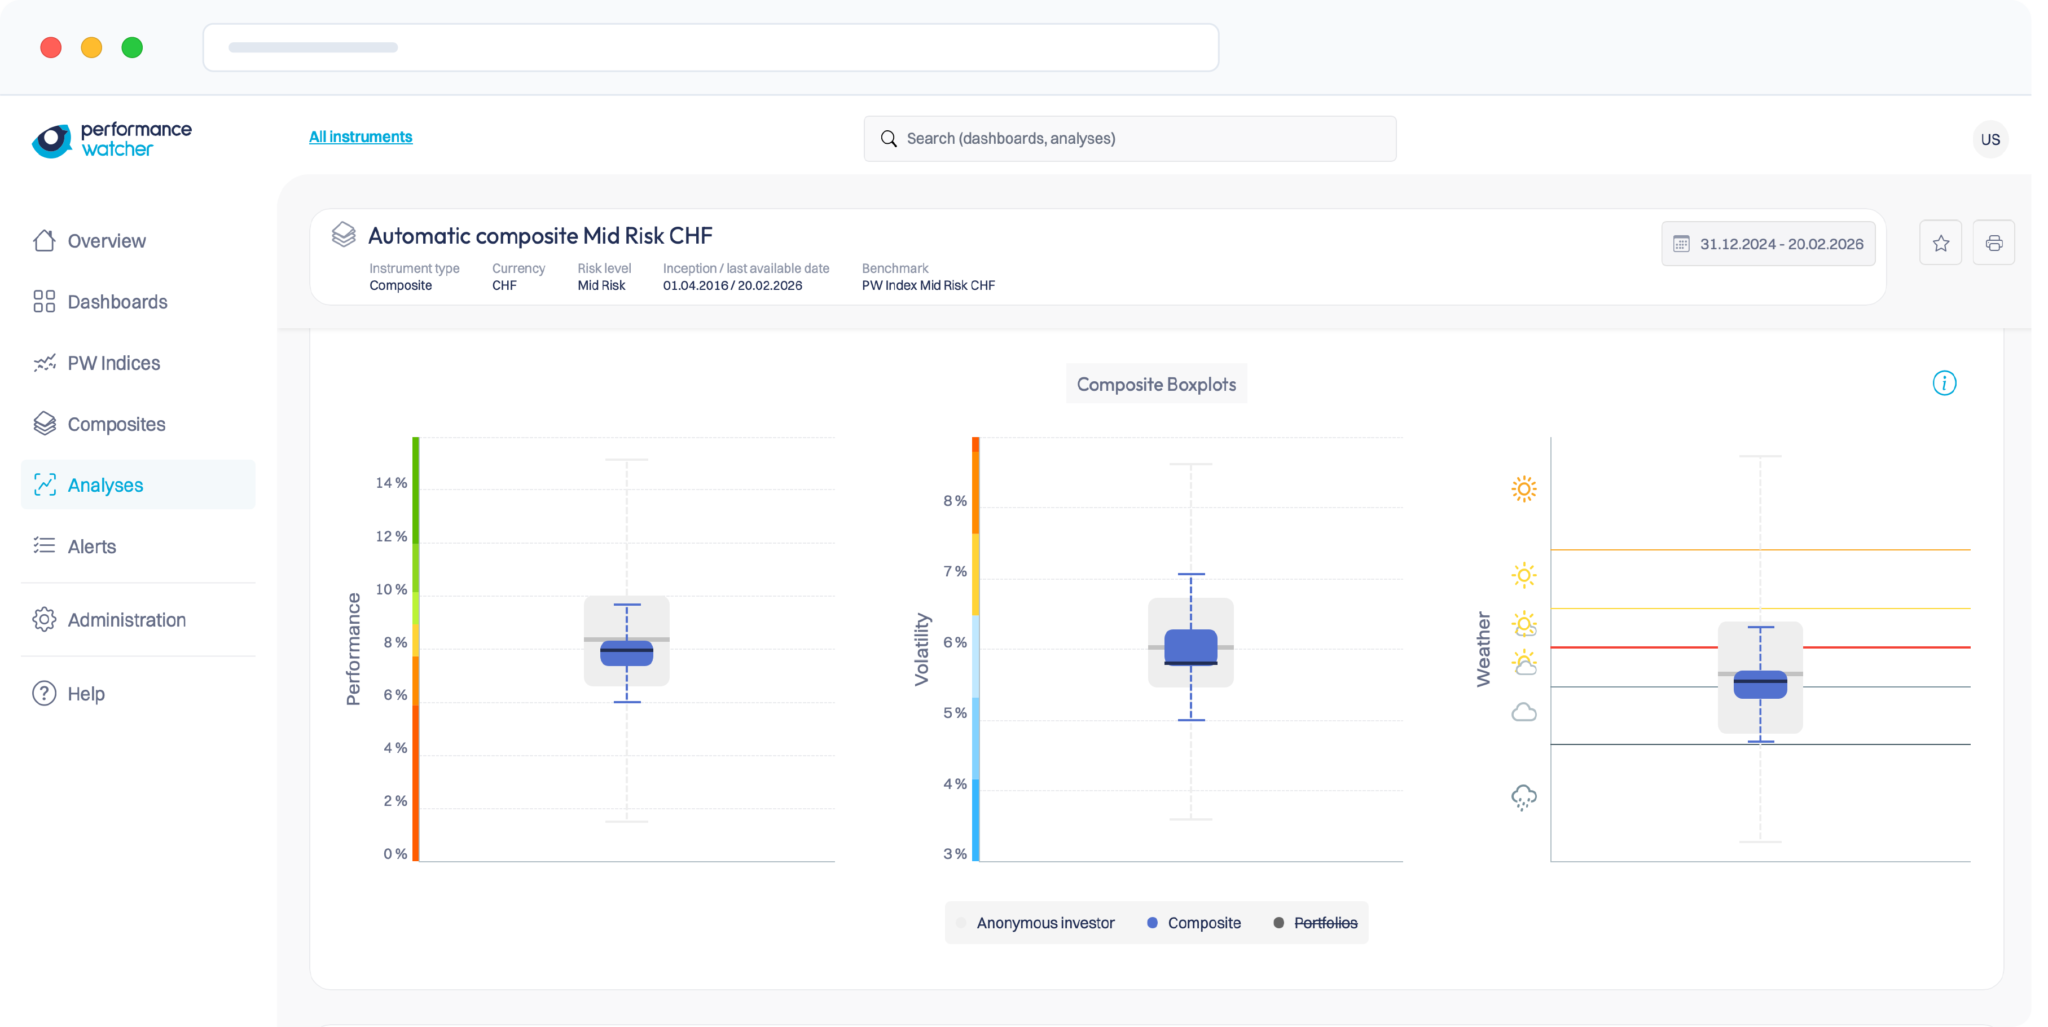
Audit your true management style
Move beyond single-line reporting. Automatically aggregate your portfolios into Composites to visualize the weighted performance of your specific strategies. Validate your Alpha with objective precision against the Performance Watcher Indices (PWI+) to see exactly how your management style performs against the relevant peer group.
Customization & Configuration
Create composites automatically or manually by grouping portfolios by risk profile, currency, or management team to isolate and analyze specific strategies.
Regulatory Compliance
Instantly detect if a specific strategy is drifting from its defined risk budget, ensuring alignment with internal governance and regulatory mandates.
Growth Engine
Turn your verified results into a marketing asset. Your Composites can be certified to provide prospects with undeniable proof of your management quality.
Finance-grade reliability
We engineered Performance Watcher to meet the rigorous standards of the Swiss banking industry. Our infrastructure is built on four non-negotiable pillars designed to ensure seamless integration, absolute security, and total alignment with your business interests.

Frictionless Connectivity
We automate the data flow directly from your PMS or Core Banking System, eliminating manual administration and ensuring your analysis is always based on fresh, accurate data.

Sovereign Security
We apply a strict “Privacy by Design” protocol. Your data is anonymized at the source, encrypted, and hosted exclusively in Switzerland, ensuring full compliance with all European regulatory standards.

Auditability
Every calculation is fully documented and reproducible. Your compliance and product teams can verify every single metric, ensuring total clarity on the methodology used.

Uncompromised Neutrality
Our business model relies solely on software subscriptions, neither providing wealth management services nor putting end clients in contact with wealth managers, in order to ensure our neutrality.
FAQ our clients ask
Is my client data truly anonymous?
Yes. We apply a strict “Privacy by Design” protocol. All data is anonymized before it leaves your server. We only store performance metrics and risk profiles. The data is hosted exclusively in Switzerland .
How much effort is required for integration?
Minimal. Performance Watcher is “PW Ready” with most major PMS and Core Banking Systems. The data feed is automated via API or SFTP. There is no daily manual input required from your teams.
Do you sell or share the data you collect?
Never. Our independence is our most valuable asset. We are a software provider, not a data broker. Our revenue comes solely from user subscriptions, ensuring our interests are 100% aligned with yours.
Who are we compared against?
You are compared against a relevant universe of peers, not theoretical indices. We aggregate thousands of actual portfolios from private banks, independent asset managers, and family offices, segmented strictly by risk budget and reference currency.
Ready to see your own weather?
Join the community defining the new standard of transparency, alongside Piguet Galland, SoundCapital, and HBS Family Office.